You have opened one of these apps, seen a three-colour grid and a payout line that reads something like 2x for red, 2x for green, 4.5x for violet, and the colour prediction house edge is the one number that explains why that screen is not a coin flip with extra colours. Almost every page that ranks for this topic says the phrase and then moves on – it asserts that a margin exists without ever showing you the multiplication. That is a strange gap, because the arithmetic is short enough to fit on the back of a receipt.
There are ten numbers, each payout is printed on the screen, and four steps get you from the payout table to the exact percentage the platform keeps. This breakdown does those four steps in full, shows why the violet option is quietly the most expensive square on the board, and then puts the result next to how a football bookmaker’s margin is built, because the two are not the same shape at all. One honesty line before we start: these are 18+ real-money products, and across many rounds a loss is the expected outcome, not the unlucky one.
Table of Contents
What The Payout Table Actually Promises
The commonly advertised structure works like this. Each round draws a single digit from 0 to 9. Those ten digits are then mapped onto three betting options, and that mapping is where everything interesting happens.
- Green usually covers 1, 3, 5, 7 and 9 – five of the ten digits.
- Red usually covers 2, 4, 6, 8 and 0 – the other five.
- Violet covers just 0 and 5 – two digits, which sit inside the red and green sets rather than outside them.
- A single number bet, where offered, covers exactly one digit.
- The two shared digits, 0 and 5, pay a reduced amount on the colour bet – typically 1.5x rather than the headline figure.
Read that list slowly and the first thing to notice is that nothing is hidden. The platform publishes the digit map and publishes the multipliers. That openness is part of why the claim “it is rigged” is usually the wrong complaint to make: the arrangement does not need to cheat anybody, because the published numbers already do the work. A player who is betting red is not being tricked about having a 50% chance. They genuinely have a 50% chance. What they are not being told, in plain language, is that a 50% chance paid at less than 2x is a slow, arithmetic certainty running against them.
It also matters that the three options are not separate bets on separate events. They are three different prices quoted on one draw of one digit. That is why the colour prediction house edge can be computed exactly rather than estimated from scraped results: once you know the digit map and the multiplier attached to each branch, there is nothing left to find out. No sample size is needed, no history of past rounds, no access to the operator’s books. Two published facts are the whole input.
The headline colour payout is almost never a clean 2x. It is generally quoted as 1.96x, or as 2x with a 2% commission deducted from winnings – two descriptions of the same deduction. Combine that small shave with the reduced payout on 0 and 5, and you have the whole mechanism. Everything in the next section is just putting arithmetic to it.
The Colour Prediction House Edge In Four Worked Steps
Here is the full calculation for a 100-unit bet on green, using the structure above. Four steps, no statistics background needed.
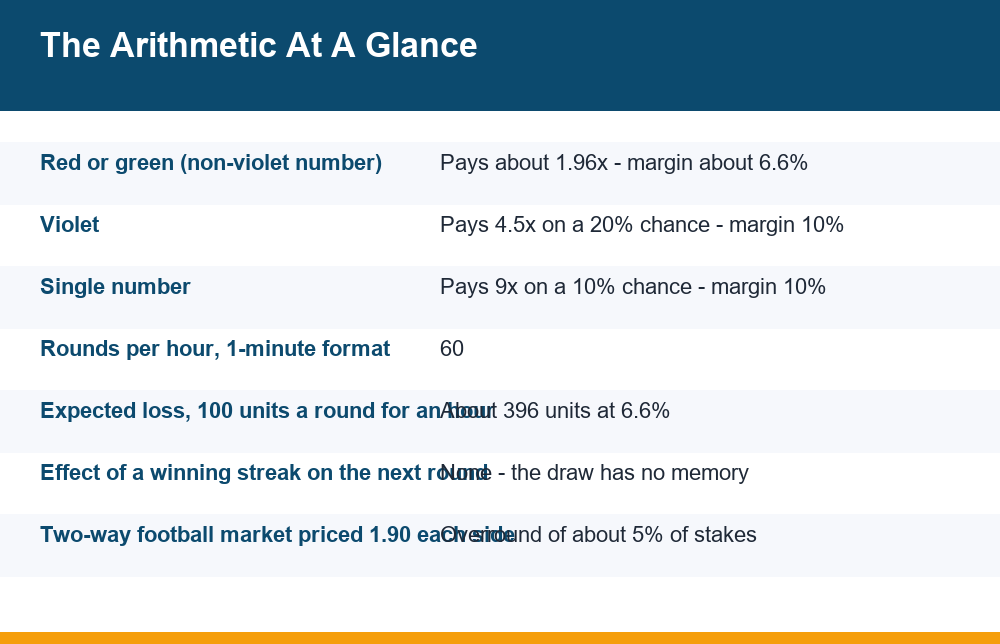
- Count the outcomes. Ten digits, each equally likely, so each digit is a 10% chance. Green hits on 1, 3, 7 and 9 at the full rate – that is 40%. Green also hits on 5, but at the reduced rate – another 10%. Green loses on 0, 2, 4, 6 and 8 – 50%.
- Read the payout against each branch. The 40% branch returns 1.96x the stake, so 196 units. The 10% branch returns 1.5x, so 150 units. The 50% branch returns nothing.
- Multiply each probability by its return and add them up. That is
0.40 × 196 = 78.4, plus0.10 × 150 = 15.0, plus0.50 × 0 = 0. Total expected return: 93.4 units. - Subtract from the stake. You put in 100 and the arrangement returns 93.4 on average. The difference, 6.6 units, or 6.6%, is the margin the platform retains on every 100 units staked on that option.
That 6.6% is the answer. It is not a guess, not an estimate drawn from results histories, and not something that varies with how cleverly you pick. It falls straight out of the two published facts – the digit map and the multiplier – and it applies identically to red by symmetry.
The word “expected” in step three is doing specific work and is worth pinning down, because it is where most arguments about these numbers go wrong. An expected return of 93.4 is not a prediction about your next round, which will return either 196, or 150, or nothing at all. It is the long-run average of those three outcomes weighted by how often each occurs. Nobody experiences 93.4 on a single round. The figure describes what the arrangement converges towards as rounds accumulate, which is exactly the thing a fast-cycling format produces in volume.
Run the same four steps on the other options and the picture completes itself. The table below does that, with a fair coin flip at the bottom purely as a reference point for what a zero-margin version of the same bet would look like.
| Bet | Winning digits and rate | Win chance | Expected return per 100 staked | Margin kept |
|---|---|---|---|---|
| Green | 1, 3, 7, 9 at 1.96x; 5 at 1.5x | 50% | 93.4 | 6.6% |
| Red | 2, 4, 6, 8 at 1.96x; 0 at 1.5x | 50% | 93.4 | 6.6% |
| Violet | 0 and 5 at 4.5x | 20% | 90.0 | 10.0% |
| Single number | one digit at 9x | 10% | 90.0 | 10.0% |
| Fair coin flip (reference only) | one side at 2.0x | 50% | 100.0 | 0% |
Exact multipliers differ between implementations, and some use a 1.95x or 1.92x colour payout, or a different reduced rate on the shared digits. Swap your own numbers into step two and step three and the method still works – that is the point of showing the steps rather than just the result. What does not change is the direction of the answer: in every published variant anyone has shown the arithmetic for, the expected return lands below 100.
Why Violet And The 0 And 5 Numbers Hide The Biggest Margin
Violet is presented as the exciting option, and in presentation terms it works – a 4.5x multiplier looks like an opportunity next to a 2x. Step through the maths and it is the most expensive square on the board, tied with the single-number bet at a 10% margin, which is roughly half again as costly as the colour bets.
The reason is arithmetic rather than conspiracy. Violet wins on exactly two of ten digits, so a zero-margin payout would be 5x. Paying 4.5x against a 20% chance means 0.20 × 450 = 90, and the 10 units short of break-even are the margin. The headline multiplier is big, so the shortfall is big too, but it does not look big, because 4.5 and 5 feel close together in a way that 1.96 and 2 also feel close together – and the second comparison is the one people instinctively check.
The dual role of 0 and 5 is the other quiet piece. Those digits appear to give colour bettors a bonus consolation win, and in isolation a reduced 1.5x return does beat losing the stake outright. But placed inside the full calculation, that branch is what pulls green’s expected return from 98 down to 93.4. A 1.5x return is still well short of what a fair 2x would have paid on the same branch. A consolation that arrives below the fair rate is a cost presented as a courtesy, and the colour prediction house edge on red and green is roughly two-thirds composed of it.
You can see that split clearly by rerunning step three with the shared digit removed. If all five green digits paid 1.96x, the expected return would be 0.50 × 196 = 98, a margin of 2% – which is simply the commission shave on its own. The remaining 4.6 points come entirely from the reduced rate on the digit 5. The feature that looks like generosity is more than twice the size of the fee that looks like a cost.
There is a general lesson here that outlives this particular format. When a product offers several bets on the same underlying draw at different multipliers, those bets almost never carry the same margin. The option that is visually promoted is frequently the one with the worst expected return, because a larger multiplier gives more room to shave without the shave being obvious to anyone who has not done the division.
Round Speed: How A Small Margin Becomes A Large Number
A margin of 6.6% does not sound alarming on its own. Plenty of ordinary transactions carry a bigger spread than that. The thing that makes it consequential here is that the margin is charged on turnover, not on deposits, and these formats are built to generate turnover extremely fast. Rounds commonly close every 30 seconds, one minute, three minutes or five minutes. On the one-minute format, an hour of continuous play is sixty separate charges of the margin.
| Rounds played | Turnover at 100 per round | Expected loss at 6.6% | Expected loss at 10% |
|---|---|---|---|
| 10 | 1,000 | 66 | 100 |
| 60 (about one hour) | 6,000 | 396 | 600 |
| 200 | 20,000 | 1,320 | 2,000 |
| 1,000 | 100,000 | 6,600 | 10,000 |
Those figures are averages, not forecasts of any single session. Variance is large enough that an individual hour can easily finish ahead, and that is precisely why the format holds attention. But the column totals are what the arrangement is built around, and they are also why the deposit figure is a poor way to think about exposure. Somebody who deposits 2,000 units and recycles winnings through 200 rounds has staked 20,000 units of turnover. The colour prediction house edge has been applied to all of it.
Speed has a second effect that the table cannot show. A format that resolves in sixty seconds leaves almost no interval between one decision and the next, so the ordinary checkpoints – noticing the balance, noticing the time, deciding whether to stop – never arrive at a natural pause. The arithmetic does not care about this, but the number of times the arithmetic gets applied does, and that number is the only variable in the whole calculation that a player actually controls.
This is the structural difference from a weekend football accumulator, where a fan places one bet and waits ninety minutes for a result. Same order of margin percentage, radically different number of applications per hour. If you want the two formats set side by side in more detail, the comparison of how colour rounds differ from in-play football markets covers the pacing question specifically.
How A Football Odds Margin Works, Compared
A football fan reading this already has an intuition for bookmaker margins, even without the vocabulary. It is worth laying the two mechanisms next to each other, because they look similar and are built differently in one important way.
Take a two-way football market priced at 1.90 on each side. Convert each price to an implied probability by taking its reciprocal: 1 ÷ 1.90 = 0.5263, or 52.63%. Do that for both sides and they sum to 105.26%, not 100%. That extra 5.26 percentage points is the overround, and expressed as a share of total stakes it works out at about 5%. The arithmetic mirrors step three above exactly – a 50% chance paid at 1.90 returns 0.50 × 190 = 95 per 100 staked.
So in pure percentage terms, a typical two-way football margin sits a little below the colour bets and well below violet. The real distinction is not the size. It is what the margin is applied to:
- In football, the bookmaker’s implied probability is an estimate of something genuinely uncertain – form, injuries, weather, motivation. The margin is added on top of a judgement call, and the price moves as money and information arrive.
- In a colour round, the probability is not estimated at all. It is fixed and published: five digits in ten, or two in ten. There is nothing to form a better view about, because the correct view is already printed on the screen.
- That means a football margin is a charge for someone’s opinion about an uncertain event, while the colour prediction house edge is a charge for arranging a draw whose odds nobody disputes.
- It also means claims of an informational advantage, which at least make conceptual sense in a sports market, make no sense here. You cannot know more about an unbiased digit draw than the digit map already tells you.
- And it means the two margins behave differently over time. A football price can be mispriced, in either direction, because it rests on a judgement. A published digit map cannot be mispriced – it either matches the draw or it does not.
None of this is an argument that football betting is the smarter activity. The margin is still there, it still runs against the player, and the honesty line at the top applies to both. The point is narrower: when somebody uses sports-betting language – reading the board, finding value, following the signal – to describe a colour round, the words have been carried across from a context where they referred to something real into one where they refer to nothing. The piece on why football supporters get drawn into chance-based formats goes further into how that vocabulary transfers.
Why Most Players Lose Money Over Time
Put the previous sections together and the answer stops being mysterious, because the colour prediction house edge does all of the explaining on its own. Over time, players lose because they are repeatedly accepting a return of roughly 93 or 90 units for every 100 staked, and because the format is built so that “over time” arrives within a single evening rather than over years.
Three things amplify it beyond the raw percentage. The first is recycling: winnings that stay inside the app become the next round’s stake, so the same money is charged the margin repeatedly, and lifetime turnover ends up several multiples of whatever was ever deposited. The second is withdrawal friction – minimum thresholds, turnover conditions attached to bonus credit, verification delays – all of which keep balances in play, and all of which increase turnover whatever the stated reason. The third is stake escalation after losses, where stakes are raised to recover faster, which raises turnover at the exact moment judgement is worst.
Notice that none of these three require the draw to be unfair. A perfectly honest, perfectly random digit draw, combined with a published payout below the fair rate and a structure that maximises replays, produces the observed outcome on its own. That is the more uncomfortable conclusion, and it is the one the ranking pages tend to skirt: there is no villain to catch, only a published number that most people never multiply out.
It is also worth separating two different questions that get merged constantly. “Is the draw honest?” and “Is this a losing proposition?” are independent of each other. A draw can be entirely honest and the proposition still negative, which is the case the arithmetic above describes. Arguing about the first question while ignoring the second is how a conversation about these formats stays unresolved indefinitely, because the first question is hard to verify from outside and the second is settled by two numbers on the screen.
If any of the amplifiers above describe your own pattern – recycling balances you meant to withdraw, raising stakes to recover, losing track of how long a session has run – that is the signal worth taking seriously, rather than a bad run of colours. Independent non-commercial services exist for exactly that conversation and sell nothing; GamCare’s summary of the free support available to anyone affected by gambling is a reasonable place to start.
Streaks, Hot Colours And Why The Next Round Has No Memory
The single most common question about these formats is whether a run of results changes what comes next. Green has landed seven times consecutively – is red now due? Or has green turned hot and become the smarter side?
Both versions of the question assume the draw remembers, and an unbiased draw does not. If each round independently selects one digit from ten, then the probability of green on the next round is 50% after seven greens, after seven reds, and after any sequence you care to write down. The history is visible to you and invisible to the mechanism. Betting red because it is overdue is the gambler’s fallacy; betting green because it is hot is the same fallacy wearing the opposite jersey. Neither changes the expected return, which stays at 93.4 per 100 staked, because the colour prediction house edge is a property of the payout structure and not of the recent results list.
Long runs also feel far rarer than they are. Seven consecutive results on one side of a near-even draw has a probability of about one in 128 – unremarkable in a format that produces sixty rounds an hour. Scroll any results history long enough and you will find streaks, clusters, apparent alternating patterns and sequences that look designed. Random data reliably looks patterned to humans; that is a fact about pattern recognition, not about the data.
The same point applies to the small statistics people quote from those histories. In a hundred rounds of a 50% draw, counts of 45 or 55 on one side are entirely ordinary, and either one can be presented as a bias if you want it to be. The only way a genuine imbalance in the draw could be established would be through vastly more data than a results panel displays, and even then it would need to be large enough to overcome a margin of 6.6% before it changed anything practical. A tiny imbalance in an unfavourable payout structure is still an unfavourable payout structure.
This is also why the results history panel is such an effective piece of interface design. It is presented as information, it costs nothing to display, and it has exactly zero predictive content. What it reliably does is encourage a next bet by giving the player something to reason from.
Skill Or Chance: What The Round Structure Settles
The skill-versus-chance framing gets argued about a lot, usually in the abstract. The round structure settles it fairly cleanly if you ask a narrow question: is there any decision available to the player that measurably improves the expected return?
There are only three decisions in a colour round – which option to back, how much to stake, and whether to play at all. The first does not help, because every option’s expected return is already fixed and below break-even, so choosing between them is choosing between a 6.6% charge and a 10% charge, not between a losing bet and a winning one. The second does not help either, because stake size scales the outcome proportionally; it changes the variance and the size of the eventual number, never its sign. Doubling after a loss, the pattern that circulates most widely, multiplies turnover and therefore multiplies expected loss, and it collides with table limits and bankroll limits exactly when it most needs neither to exist.
That leaves the third decision, which is the only one with any leverage at all – and it works by reducing the number of times the margin is charged, not by improving the odds on any single round. That is the structural distinction from a game like chess or a competitive card game, where a stronger player’s choices genuinely shift results. Here the available choices do not touch the mechanism.
It is also why claims about pattern-reading software deserve scepticism by default. There is no pattern to read in an unbiased draw, so a product sold on that premise is selling a story rather than a method, and the colour prediction house edge is unaffected by whatever the software reports. The breakdown of what so-called prediction apps are actually doing walks through the usual mechanics behind those claims.
Mistakes To Avoid When Someone Shows You Proof
Once you can run the four steps yourself, most of the material circulating about these games becomes easy to sort. A few recurring errors are worth naming directly, because they are what the arithmetic above is most useful for catching.
- Treating a screenshot as evidence. A profit screenshot shows one outcome from a distribution with large variance. In any population of players, some finish ahead; that is a property of randomness, not proof of a method. Screenshots are also trivially fabricated.
- Confusing win rate with profitability. Somebody can win 50% of colour rounds – in fact, that is roughly what everyone does – and still lose steadily, because the winning rounds pay less than the fair rate. A high hit rate is not the same as a positive return.
- Mistaking the deposit for the exposure. Turnover is what the margin is charged on. Recycled balances mean the figure at risk is often several times the amount ever added.
- Assuming a bigger multiplier means better value. Violet pays more than twice the colour bets and keeps a larger share. A multiplier only means something once you have divided it against the chance of hitting.
- Reading the results history as data. It has no predictive value. It is there to prompt the next round.
- Believing a staking pattern can overcome the margin. No sequence of bet sizes changes the expected return per unit staked. Staking patterns change how the loss is distributed over time, nothing more.
- Accepting a stated percentage without the working. If someone quotes a margin figure, ask which digit map and which multipliers it came from. The four steps take a minute and settle it.
There is a separate, more practical category of risk worth keeping clearly apart from the arithmetic: the deposit, bonus and withdrawal mechanics layered on top. Bonus credit carrying turnover conditions, balances that cannot be withdrawn below a threshold, referral structures that pay for recruiting other players, and requests to move money through personal accounts are all described here only so that they can be recognised when they appear, never as something to pursue. The margin calculation above is an honest description of an openly published payout table. Those mechanics are a different question altogether, and they are the reason that even a reader entirely comfortable with the colour prediction house edge should treat the surrounding platform with considerably more caution than the maths alone would suggest.
Frequently Asked Questions
What is the house edge in colour prediction games?
On the commonly advertised structure the colour prediction house edge is about 6.6% on red or green and 10% on violet or a single number. For green: four digits (1, 3, 7, 9) pay 1.96x at a 40% chance, the digit 5 pays a reduced 1.5x at a 10% chance, and the remaining five digits lose. That gives an expected return of 0.40 × 196 + 0.10 × 150 = 93.4 units per 100 staked, so 6.6 units are retained. Violet pays 4.5x on a 20% chance, returning 90 per 100 – a 10% margin. Exact multipliers vary between implementations, but the direction does not.
Why do most colour prediction players lose money over time?
Because every round returns roughly 90 to 93 units for each 100 staked, and the margin is charged on turnover rather than on deposits. With rounds closing every 30 seconds to five minutes, an hour of play can apply that charge sixty times. Three things amplify it: winnings recycled into the next round, withdrawal thresholds and bonus turnover conditions that keep balances in play, and stake escalation after losses. None of this needs the draw to be unfair – an honest random draw with a payout below the fair rate produces the same result.
How does the platform make money in colour prediction?
By paying less than the fair rate on every option. A 50% chance needs a 2x return to break even; the colour bets typically pay 1.96x, and the shared digits 0 and 5 pay only about 1.5x. A 20% chance needs 5x; violet pays 4.5x. The gap between fair and offered is the revenue, and it is collected on the total amount staked. No cheating is required, because the shortfall is printed openly on the payout table – most players simply never multiply it out.
Is colour prediction a game of skill or chance?
Chance. There are only three decisions available – which option to back, how much to stake, and whether to play – and none of them improves the expected return. Choosing between options means choosing between a 6.6% charge and a 10% charge. Stake size scales the outcome proportionally, changing variance but never the sign of the expected result. And unlike a sports market, there is no uncertain probability to form a better view about: the digit map is published, so there is nothing to estimate and no informational edge to find.
Does a winning streak change the odds of the next round?
No. In an unbiased draw each round is independent, so the chance of green on the next round is 50% whether green has just landed seven times or not once in twenty. The draw has no memory of the results you can see. Believing red is now “due” and believing green has turned “hot” are the same error in opposite directions. Long streaks also feel rarer than they are – seven consecutive results on one side of a near-even draw happens roughly once in 128 sequences, which is unremarkable at sixty rounds an hour.